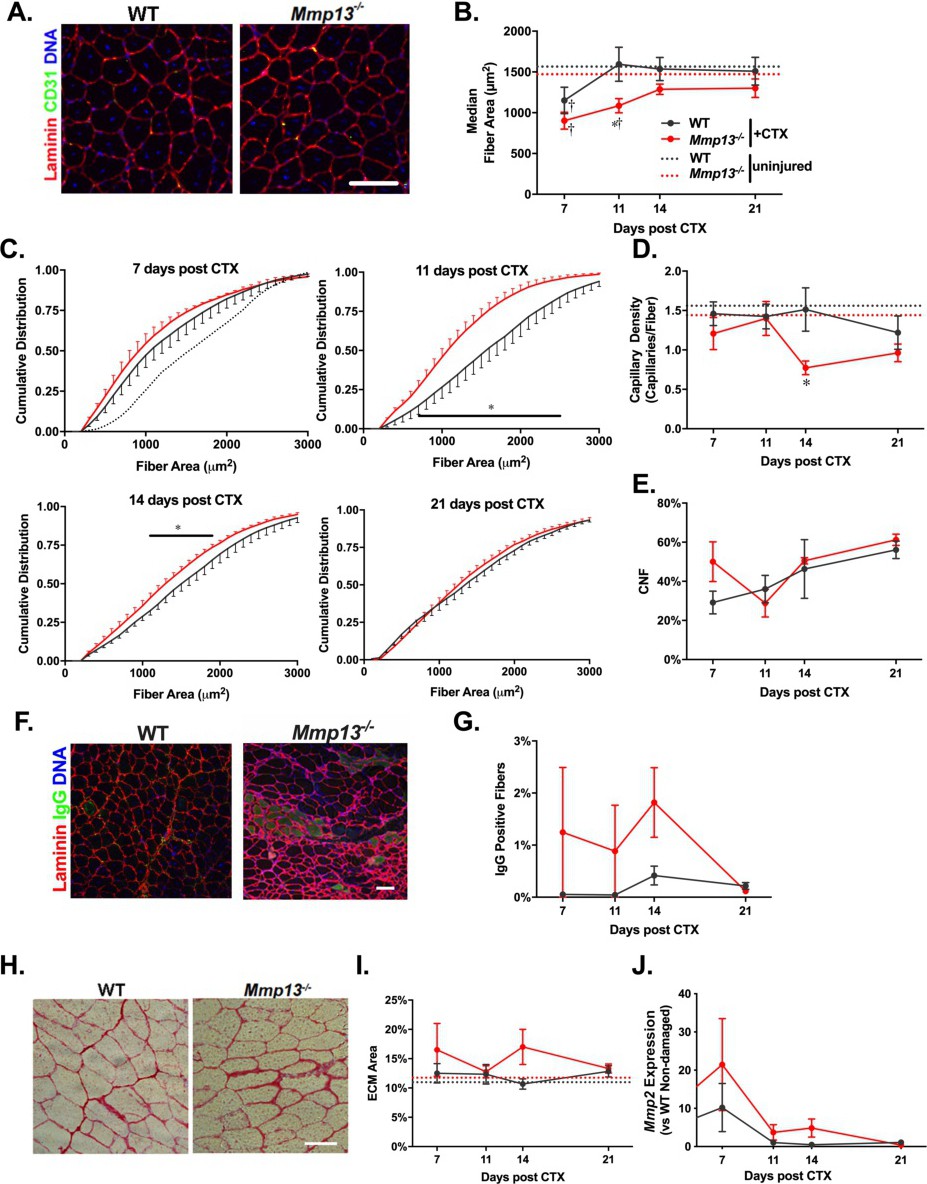
Fig. 2. Mmp13-/- muscles have impaired regeneration following cardiotoxin injury. (A) Examples of WT and Mmp13-/- TA muscles with staining of laminin, CD31, and DNA on TA muscles 14 days after cardiotoxin (CTX) injection. Scale bar 50 μm. (B) The median fiber area is decreased for both genotypes 7 days after CTX and recovers to baseline by day 11 for WT, but recovery is significantly delayed in Mmp13-/- TA muscles. (C) The cumulative distributions of fiber areas from WT and Mmp13-/- TA muscles 7 days (WT N=8;Mmp13-/- N=4), 11 days (WT N=8;Mmp13-/- N=7), 14 days (WT N=6;Mmp13-/- N=6), and 21 days (WT N=10;Mmp13-/- N=12) following CTX injections. The uninjured WT cumulative distribution (black dotted line) is shown for reference with day 7. (D) The capillary density is significantly reduced at 14 days after CTX in the Mmp13-/- TA muscles. (E) There was no significant difference in the percentage of centrally nucleated fibers (CNF)s between WT and Mmp13-/- TA muscles throughout the injury recovery period. (F) Examples of WT and Mmp13-/- TA muscle 14 and 7 days post CTX, respectively, with staining of laminin, IgG to label damaged or necrotic fibers, and DNA. WT Day 14 was used so that rare IgG positive fibers could be shown. Scale bar 50 μm. (G) There is a significant main effect of Mmp13-/- compared to WT across the recovery timeframe. (H, I) The area fraction of ECM was similar for WT and Mmp13-/- TA muscles following CTX injury. (J) There was a significant main effect of increased expression of Mmp2 dependent on time post CTX injury, but no differences with respect to strain (all conditions N=4 per group). The * represents a significant (p<0.05) difference between WT and Mmp13-/-, with the bar representing the range of fiber areas that have a significant difference in the cumulative distribution. The † represents significant (p<0.05) difference between injured and uninjured muscles.